Guide
Time in range by hour of day
One number for the whole day hides which hours go wrong. Split it by the clock, and the hours that cost the most stand out.
The short answer
For each hour of the day, take every CGM reading from that hour over the last few weeks and count the share between 70 and 180 mg/dL (3.9–10.0 mmol/L), the consensus target range. That gives 24 numbers instead of one. The lowest hours are where most of the time out of range happens. Each 1% of a day is about 14 minutes, so an hour that sits at 50% while the rest of the day sits at 80% is easy to see.
Do weekdays and weekends apart. School, work and sleep move by hours on a Saturday, and an average of both puts breakfast spikes at two different times into one blur.
Compare with your own best days
A per-hour number says where time goes, not how much of it you could get back. A target of 100% in every hour is not useful. A fairer bar is your own good days. This is how the Where to focus card in Glide's Insights does it:
- Each day gets a score: the average of its hourly time in range. A day needs at least 12 hours with 6 or more readings, so a day with a long sensor gap is left out.
- The best 1 in 4 days (the top quarter of scores) are kept apart. Weekdays and weekends each need 8 days before the card shows them.
- Two lines per group: the typical hour (all days) and the same hour on the best 1 in 4.
- The 3-hour stretch with the biggest gap between the two lines is the window to look at.
- The gain for the whole week weighs weekdays 5 and weekends 2.
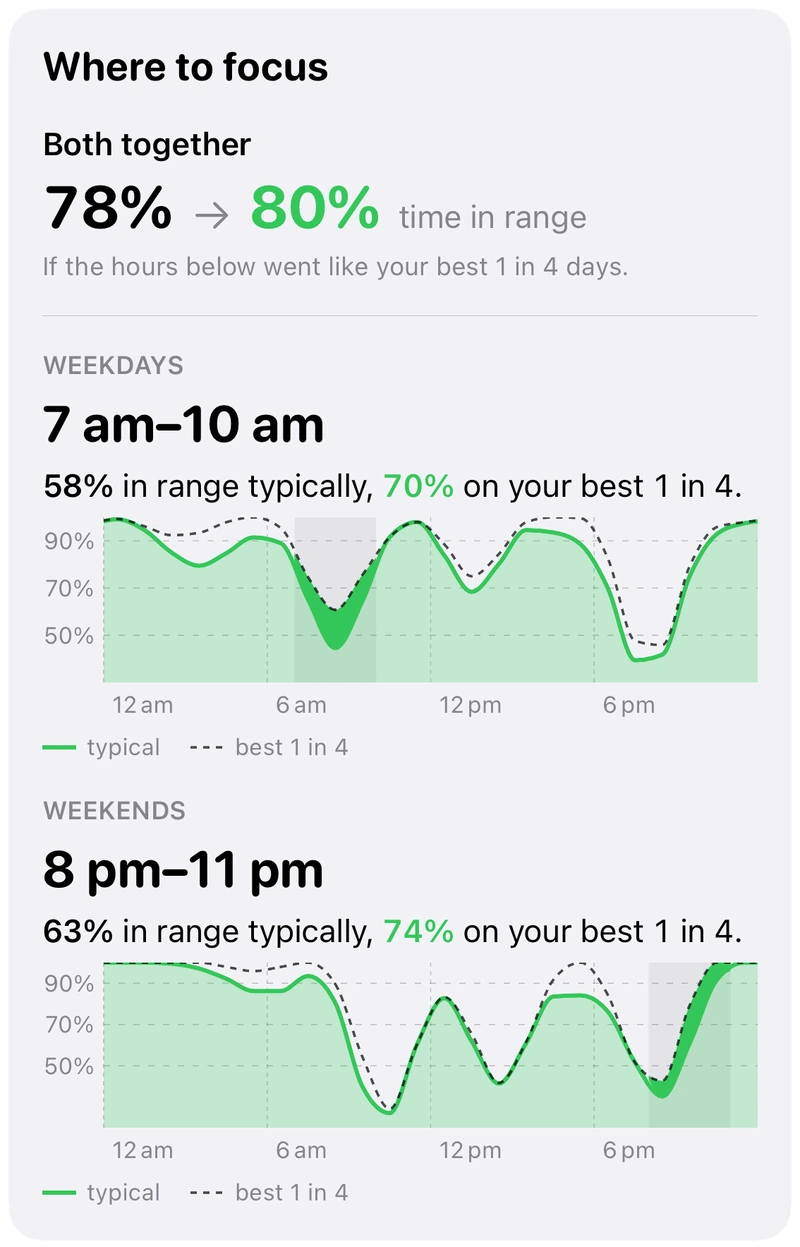
Some of every good day is luck, so the gain is the most you could expect, not a promise. It also does not say what to change. It says where to look.
Why some hours stand out
- Early morning. A rise before waking with no food and no low overnight is the dawn phenomenon. It shows as a dip in the 4 am to 8 am hours. See the glossary entry.
- After meals. The ADA Standards of Care set a peak after meals below 180 mg/dL as a goal for many adults. A spike past it shows as a dip in the hours after that meal. Meal-time spikes zooms in on those hours.
- Overnight lows. A low counts against time in range too. Read the time below range beside it: the consensus goal is under 4% below 70 mg/dL.
With pump data: what costs the time
If a Tandem pump or a pump that uploads to Glooko is connected (beta), Insights also sorts every reading out of range by what came before it. Each reading goes to the first rule it meets:
| Row | Rule |
|---|---|
| Rebound after a low | Above 180 within 3 hours after a low ends (15 minutes or more below 70) |
| High after a bolus | Above 180 within 4 hours after a bolus given by hand |
| High with no bolus before | Above 180 with no bolus in the 4 hours before |
| Low after a bolus | Below 70 within 4 hours after a bolus given by hand |
| Other lows | Every other reading below 70 |
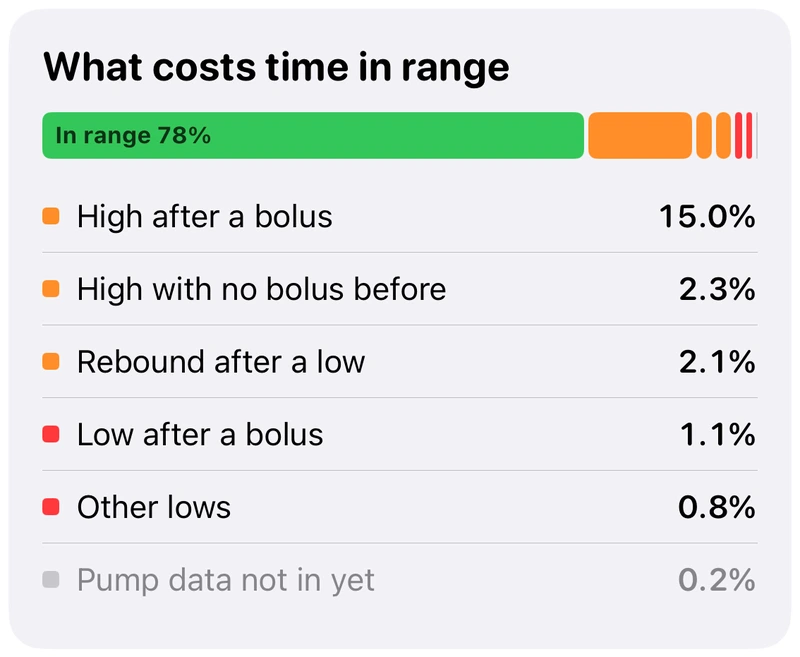
A match is an association, not proof of the cause. Talk through patterns with your care team before you change a setting.