Glide · Science
Can AI count carbs?
Glide's estimator, measured — evaluation runs from June 2026 · page updated 28 July 2026
Every insulin dose starts with a guess: how many grams of carbohydrate are in this meal? People with type 1 diabetes make that guess at every meal, every day, forever — and it cuts both ways. Count too low and glucose spikes; count too high and the extra insulin causes a low.
Glide's answer takes about four seconds at the table: photograph the plate, and AI proposes a carb count and a description — which you review and edit before anything is logged.
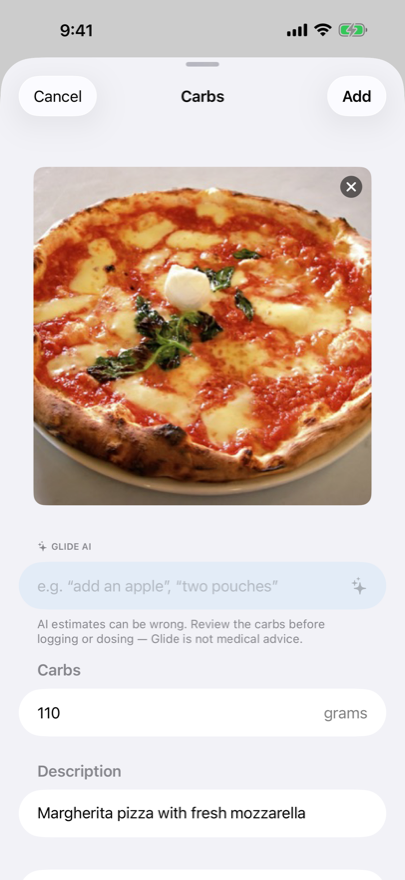
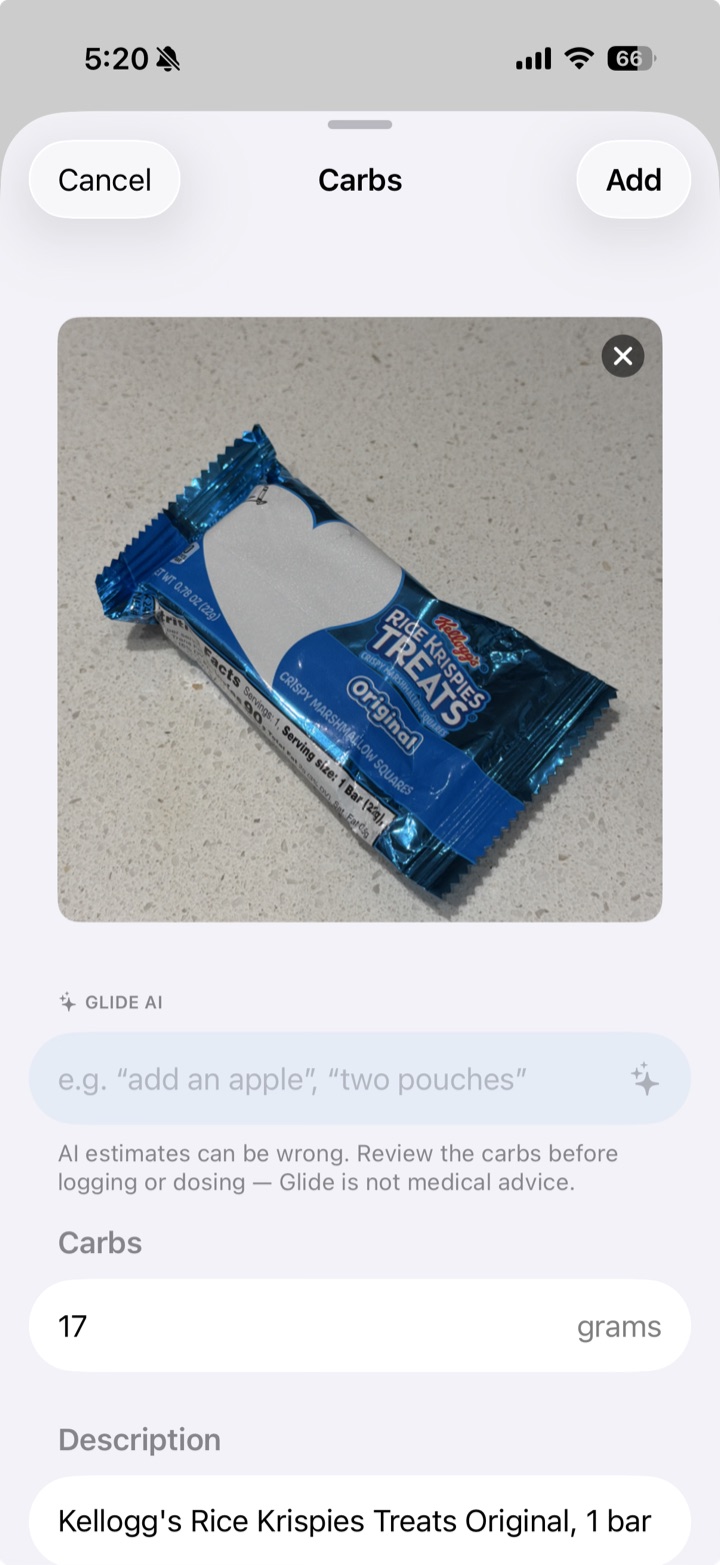
This page shows how well that actually works, measured on public benchmarks, with the comparisons and the weak spots included. Nothing here is medical advice; the estimate is a starting point, and the final number is always yours.
What happens when you snap a meal
The numbers
One production model serves every estimate — no silent fallbacks — so these numbers describe exactly what ships. Each bar below carries three figures, because no one of them is enough on its own:
- The average miss, in grams (MAE, mean absolute error) — the unit you actually dose in. A slice of bread is about 12 g.
- The meals it was measured on. The same 3 g miss is trivial on a 70 g plate and serious on a 20 g snack, so every set shows its average meal size and the miss as a share of it.
- How often it lands within ±10 g — the share of estimates close enough that the dose barely moves.
The human baseline
What hand-counting misses by, measured in 50 adults with type 1 diabetes across 448 meals against a dietitian-verified reference — meals that averaged 72 g. Every bar below is read against this (Brazeau et al.).
Corrections: “add an apple”
Glide has no standalone text estimator — typing is how you correct a photo estimate, so the correction is re-run with the photo, the prior result, and your instruction. Every test meal already has lab-weighed carbs (Nutrition5k weighs each ingredient separately), which means a scripted correction has an exact right answer to score against. Five types, 313 corrections over the plated and home photo sets:
- Stated-carb addition. “A juice box with 15 g of carbs” on a 15 g dish must total 30 g — it lands within 0.2 g of the stated amount.
- Common-item addition. “Add a medium banana” shifts the estimate by a median of 27 g, matching USDA reference data.
- Halving. “I only ate half of this” must halve the weighed total.
- Ingredient removal. “I didn't eat the rice” must subtract the rice's weighed carbs. This is the weakest correction: it subtracts the model's own estimate of the rice, so it moves in the right direction 95% of the time but can miss on amount.
- Add-then-remove. Adding something and taking it back must land where it started — it returns within about 2 g.
Scored on how far the revised total sits from that right answer, the average miss is 2.2 g.
Why this model — we ran a bake-off
We benchmarked seven vision models on the same harness and shipped the one that won every column. When it loses to something — like the specialist research rig above — we say so rather than hiding the reference.
Where it's weak — and what we do about it
- Portion size from a single photo is the hard part. The model recognizes the food well; judging how much of it is on the plate is where the 11.9 g plated error comes from — a third of the meal, and our one clearly weak column however you measure it. The Nutrition5k paper's research model, built for exactly this benchmark, roughly halves it.
- Ambiguous descriptions get ambiguous answers. “A bowl of pasta” spans 30–90 g in real life; no estimator can fix an under-specified question. Adding a hint (“small bowl”) helps.
- So nothing is logged without you. The estimate arrives in an editable field with its description, and the app reminds you that estimates can be wrong. If you know the meal better than the model, your number wins.
How we test
- Plated meals — 300 lab-weighed dishes from Nutrition5k.
- Packaged foods — 200 products from Open Food Facts, scored against the printed label.
- Home photos — a small private set of our own weighed meals, shot on a phone in a real kitchen.
- Typed corrections — run on those same photos, where the meal's carbs are already known, so an instructed change has a known right answer too.
We audit the reference data as well. A hand review of the packaged benchmark found mislabeled ground truth — impossible carb densities, placeholder serving sizes — that was inflating our error numbers; fixing the labels, not the model, moved packaged MAE from 4.7 g to 3.5 g. Benchmarks are only as honest as their labels. As evals rerun, this page gets the new numbers — including any that get worse.
What the test data looks like
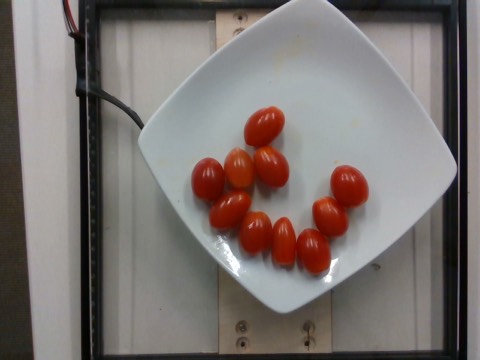
The ground truth is a known carb count per example: lab-weighed dishes for plated photos, the printed nutrition label for packaged foods — and for typed corrections, a lab-weighed meal plus the instructed change. A few real examples:
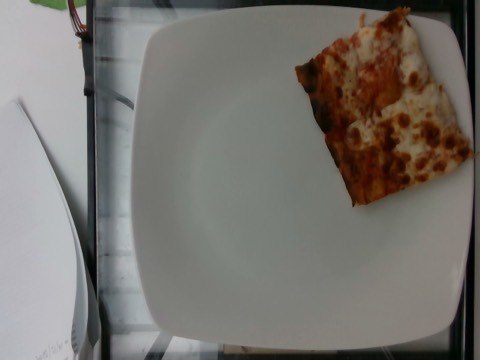

“I also drank a juice box with 15 g of carbs — add it.”
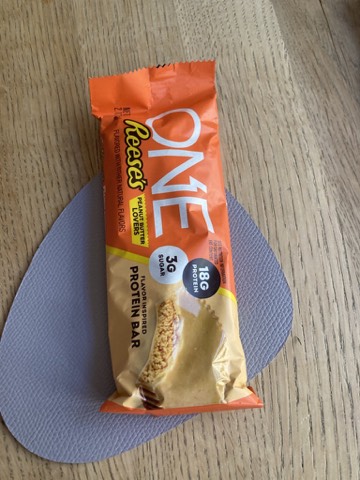
Plated images from Nutrition5k; packaged photo by Open Food Facts contributors (CC BY-SA); the home example is one of the few from our private set we're comfortable sharing — it's a product shot, not a meal.
Also on the science shelf: the glucose forecast → Why Glide shows a “do nothing” projection with a measured uncertainty cone — and refuses to chase accuracy scores.Glide displays data from a third-party CGM and is not affiliated with or endorsed by Dexcom. Not a medical device; not medical advice. Questions about the method? [email protected]